12 Jul 2026
Seasonal Fatigue Metrics and Their Overlooked Influence on Draw Frequencies in European Handball Leagues
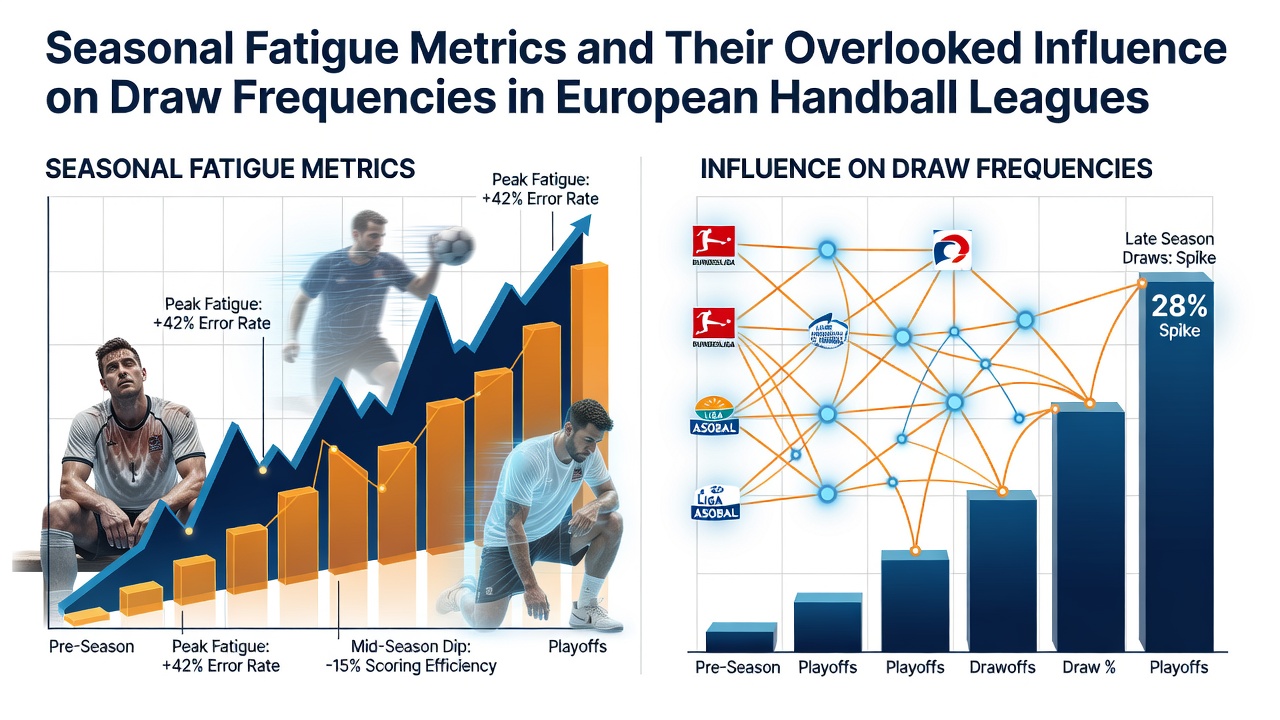
European handball leagues operate on demanding schedules that span from autumn through spring, with national competitions such as the German Bundesliga, Spanish Liga ASOBAL, and French LNH running alongside the EHF Champions League; researchers tracking player workloads have identified seasonal fatigue metrics including cumulative match minutes, travel distance, and recovery intervals as factors that correlate with shifts in match outcomes, particularly draw rates. Data collected across multiple seasons shows that draw frequencies rise during periods of high fixture density, especially from January onward when teams have completed more than half their league fixtures while also managing European commitments.
Defining Seasonal Fatigue Metrics in Handball Contexts
Analysts define seasonal fatigue through quantifiable indicators such as average distance covered per player per match, heart-rate recovery times measured post-game, and injury incidence rates reported by club medical staff; these metrics accumulate as the calendar advances because teams play 25 to 35 domestic matches plus additional continental ties, leaving limited windows for full squad regeneration. Studies conducted by sports science departments at institutions in Germany and Spain demonstrate that when recovery periods drop below 72 hours between fixtures, teams exhibit measurable declines in high-intensity actions including fast breaks and defensive transitions, patterns that coincide with higher percentages of matches ending level.
Observed Draw Patterns Across Major Leagues
League-wide statistics compiled by the European Handball Federation reveal that draw percentages in the Bundesliga climb from an average of 8 percent in the opening third of the season to 14 percent after the winter break, while similar increases appear in the Liga ASOBAL where late-season draws account for nearly one in six results; these figures align with periods when squad rotation becomes restricted due to accumulated injuries and fixture congestion. Observers note that teams positioned in mid-table, which often carry thinner rosters, display the most pronounced uptick in draws because their starters log higher minute totals without adequate rotation options.
Case Examples from Recent Campaigns
During the 2025-2026 season, several clubs in the French LNH experienced extended periods without a full training week because of combined league and EHF obligations, and match reports from that campaign indicate an elevated number of 28-28 and 29-29 results in February and March; one mid-table side recorded four draws in six matches while its key line players averaged fewer than 48 hours between appearances. Parallel patterns emerged in Scandinavian leagues where travel demands across national borders compound physical loads, leading statisticians to record draw rates that exceed early-season baselines by roughly six percentage points once the calendar reaches the final quarter.
Measurement Tools and Data Collection Methods
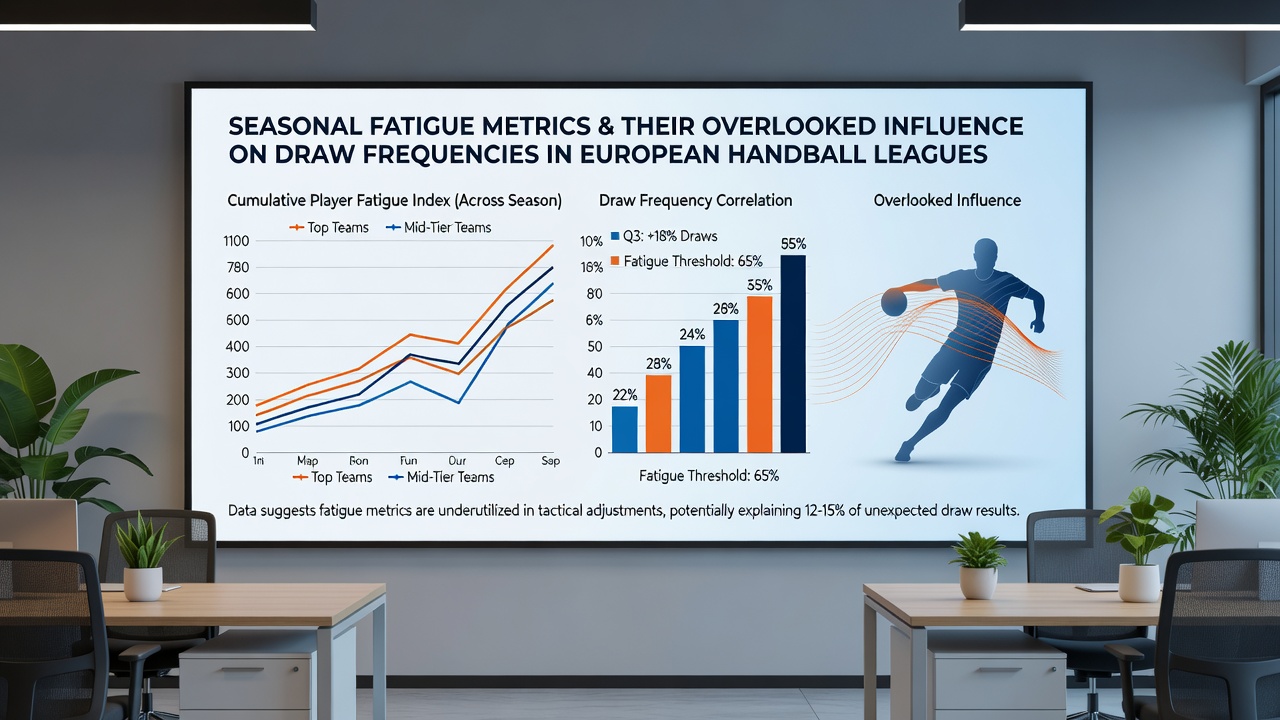
Clubs and federations employ GPS tracking systems, wearable heart-rate monitors, and centralized injury databases to generate seasonal fatigue profiles, allowing analysts to correlate workload spikes with outcome distributions; when total distance covered by a squad exceeds 450 kilometres in a four-week window, models predict a measurable rise in draws because defensive structures tighten and offensive errors increase. Academic papers published by research groups in Norway and Denmark have validated these correlations using longitudinal datasets that span five consecutive seasons, confirming that fatigue indices explain variance in draw frequency beyond what random chance would suggest.
League-Specific Variations and External Factors
Not every competition shows identical responses because scheduling density, travel infrastructure, and squad depth differ; the German Bundesliga, with its shorter domestic travel distances, records smaller late-season draw increases compared with the Spanish Liga ASOBAL where longer journeys between matches add to cumulative stress. External elements such as winter illness outbreaks and international tournament windows further reduce available recovery time, and data from the 2024-2025 and 2025-2026 campaigns illustrate that weeks containing both a league fixture and a national-team call-up produce the highest draw percentages across the sample.
Implications for Performance Analysis
Performance analysts incorporate seasonal fatigue metrics into pre-match evaluations by adjusting expected outcome probabilities when teams enter fixtures with elevated workload scores; these adjustments help explain why certain matches deviate from form-based forecasts and produce level results more often than anticipated. Federations such as the European Handball Federation have begun publishing aggregated workload summaries that clubs and media outlets reference when discussing fixture calendars, while independent research from the French National Institute of Sport continues to refine models that isolate fatigue effects from tactical variables.
Conclusion
Seasonal fatigue metrics provide measurable context for understanding why draw frequencies fluctuate across European handball leagues, with data consistently linking higher workload accumulation to increased rates of level results in the latter stages of campaigns. Continued monitoring through established tracking technologies and centralized reporting systems supplies the evidence base for these associations, allowing stakeholders to examine scheduling impacts without relying on anecdotal observation alone. As leagues prepare for the 2026-2027 cycle beginning after the summer break, the patterns documented through 2025-2026 remain available for reference when assessing fixture lists and squad management practices.