29 Jul 2026
Breakpoint Breakdown: Data Driven Approaches to Tennis Service Return Markets in Grand Slam Qualifiers
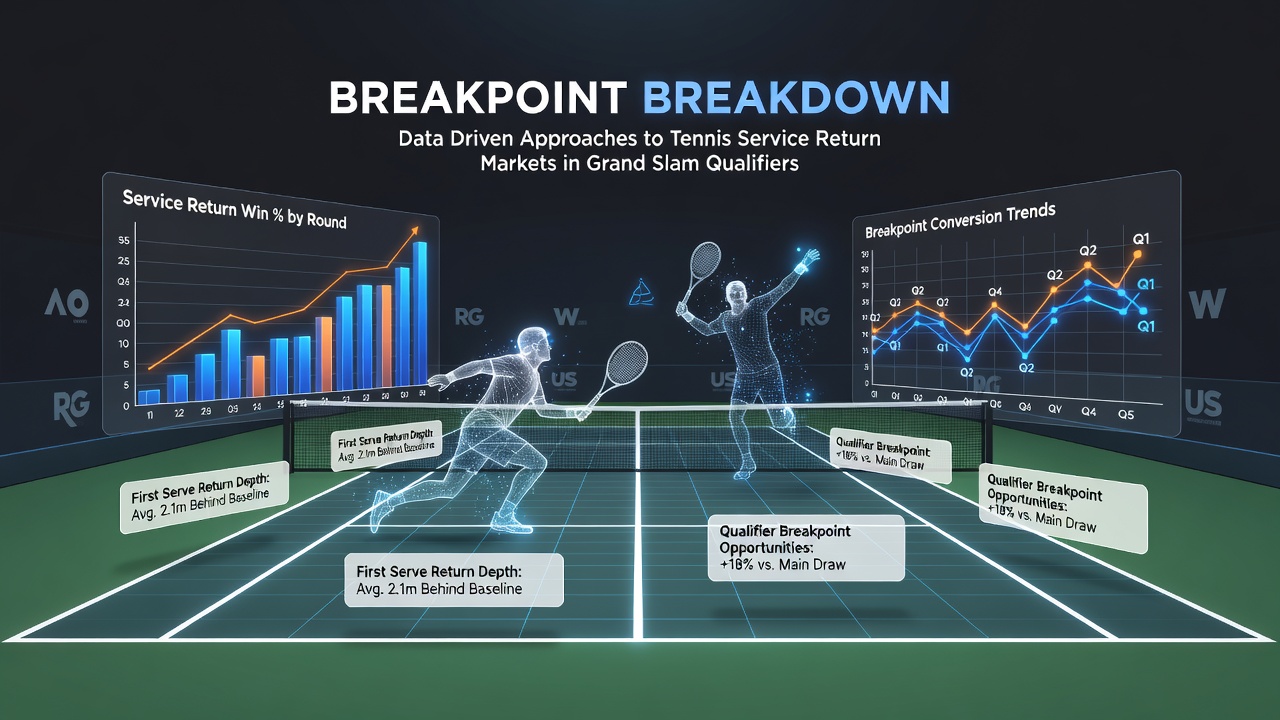
Service return markets in Grand Slam qualifiers draw attention from analysts who track performance metrics such as return points won, breakpoint conversion rates, and first-serve return effectiveness across multiple surfaces. Researchers compile historical datasets from ATP and WTA qualifying draws at events like the Australian Open, Roland Garros, Wimbledon, and US Open to identify patterns that distinguish qualifier outcomes from main-draw results. Data sources include official match statistics published by tournament organizers together with ball-tracking systems that record precise contact points and rally lengths during these early-round matches.
Core Metrics in Service Return Analysis
Analysts focus on return points won percentages, which measure how often players win points when opponents serve, and these figures often differ between qualifying rounds and main draws because of variations in opponent rankings and surface conditions. Breakpoint conversion rates provide another layer of insight since qualifiers frequently feature extended service games where one or two converted breakpoints can decide progression. Studies from academic institutions such as those published through sports science departments at European universities show that return effectiveness on second serves rises notably in best-of-three set formats common to qualifiers compared with best-of-five main-draw encounters.
Observers note that data platforms aggregate thousands of points from past qualifying matches to build baseline expectations for each surface, and grass-court events scheduled around July 2026 will generate fresh datasets once Wimbledon qualifying concludes. Those datasets allow comparison of return statistics against historical averages for the same players or similar ranking brackets. Multiple regression models incorporate variables including recent form, head-to-head return records, and fatigue indicators from travel schedules between tournaments.
Statistical Modeling Techniques Applied to Qualifier Data
Poisson distribution models and logistic regression frameworks appear frequently in published analyses of service return outcomes because they accommodate the discrete nature of point-by-point scoring. Machine learning approaches such as random forests and gradient boosting machines process large feature sets that include serve speed differentials, rally duration averages, and unforced error rates on returns. These models undergo training on datasets spanning five or more Grand Slam cycles before testing on hold-out matches from recent qualifying draws.
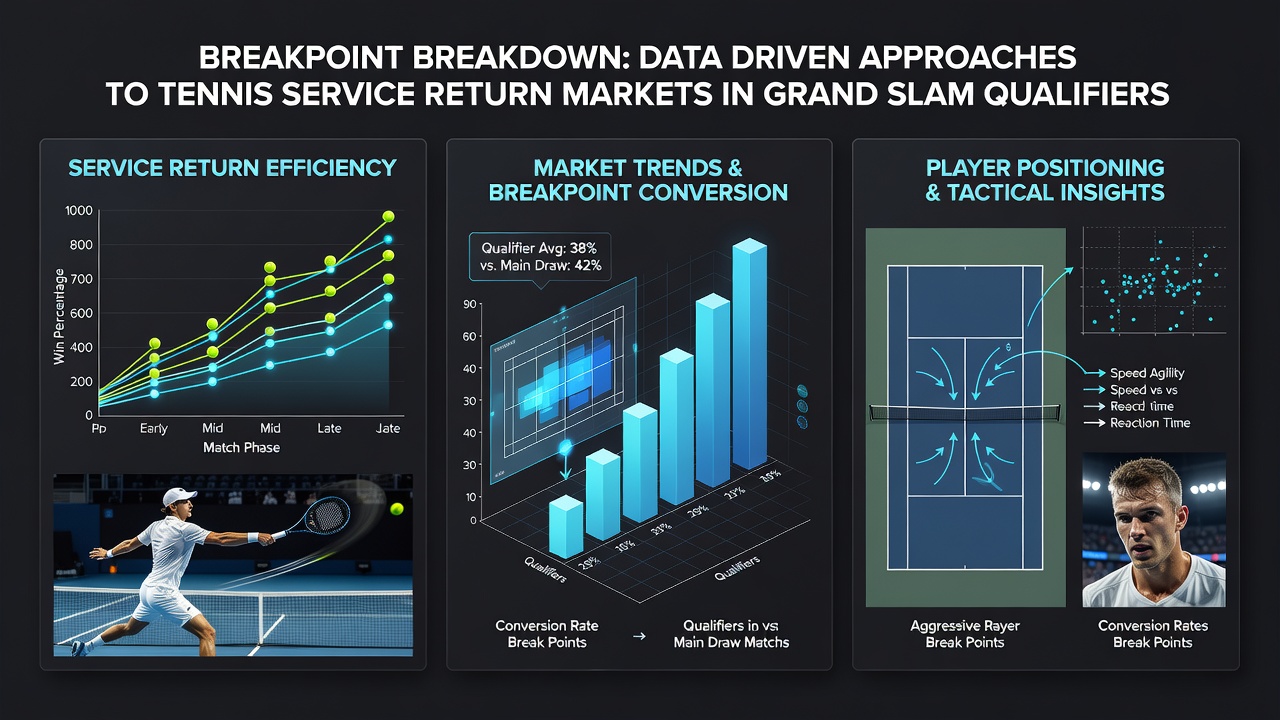
Validation procedures compare predicted return win probabilities against actual match results, and accuracy rates improve when models include surface-specific coefficients derived from clay, grass, and hard-court subsets. External organizations including the International Tennis Federation publish aggregate performance reports that researchers cross-reference with proprietary tracking data to refine inputs. One study released by a Canadian university research group examined over 12,000 qualifying matches and identified measurable shifts in return aggression metrics during late-afternoon sessions when temperatures and court speeds change.
Application to Market Evaluation Frameworks
Market evaluation frameworks translate these statistical outputs into probability estimates that account for implied margins in service return related propositions. Analysts adjust raw model outputs for factors such as player motivation in deciding matches and historical tendencies to conserve energy during qualifying weeks. Data pipelines update continuously as new matches complete, allowing recalibration of expected return percentages before subsequent rounds begin.
Geographic diversity in data sources strengthens model robustness, with inputs drawn from North American hard-court swing events, European clay-court seasons, and Australian summer tournaments providing balanced representation across playing conditions. Regulatory bodies in Australia and the European Union have issued guidelines on sports data usage that encourage transparent sourcing and documentation practices among analytics providers. These practices help maintain consistency when models incorporate live updates during ongoing qualifying tournaments scheduled for mid-2026.
Integration of Real-Time Tracking and Historical Benchmarks
Ball-tracking technology deployed at major venues supplies granular details on return contact height and depth, which feed into advanced metrics such as expected points won on returns. Historical benchmarks derived from five-year rolling windows allow identification of outliers where current qualifier performance deviates from established norms. Analysts combine these benchmarks with ranking-adjusted opponent strength ratings to generate adjusted return efficiency scores for each participant.
Cross-validation across multiple seasons reveals that service return metrics stabilize after roughly 150 tracked points per player per surface, providing a threshold for reliable inclusion in predictive models. Tournament officials continue to expand data availability through enhanced post-match reports that include rally-by-rally breakdowns, supporting more precise calibration of service return probabilities in upcoming Grand Slam qualifying events.
Conclusion
Data-driven approaches to service return markets in Grand Slam qualifiers rely on systematic collection of point-level statistics, surface-specific modeling, and continuous validation against observed outcomes. Integration of tracking technology with established benchmarks produces probability estimates that evolve as matches unfold. Continued expansion of available datasets from events scheduled through July 2026 will further refine these analytical methods while maintaining consistency with guidelines from international sports organizations and regulatory authorities across multiple regions.